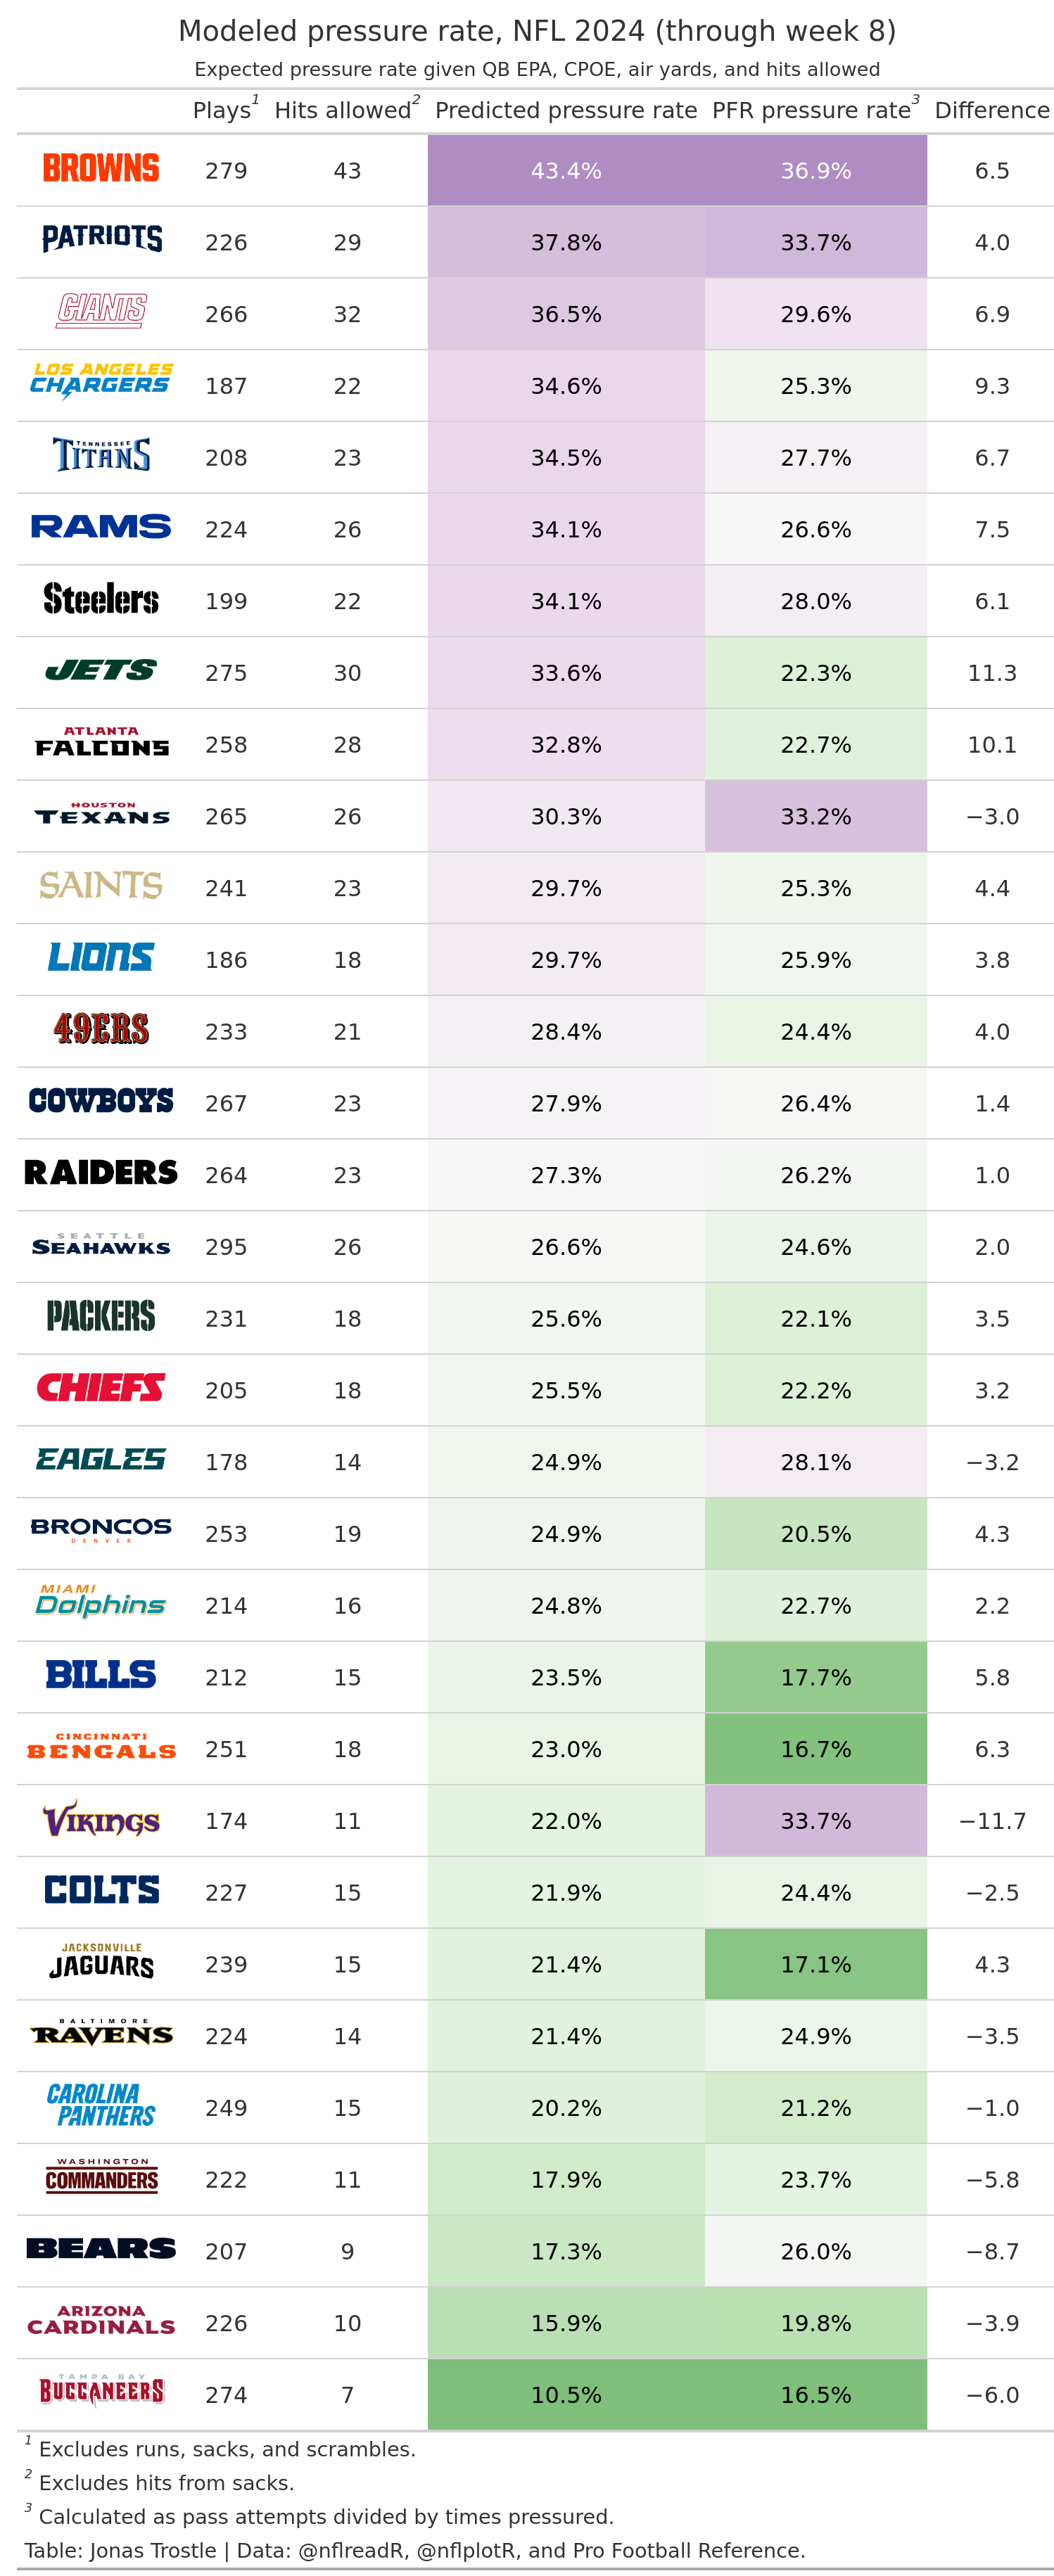
So, I’ve been working on-again, off-again on an NFL pressure model for a year and a half, maybe two. It’s really just a mutation of Richard Mcelreath’s cat-bird model (https://gist.github.com/rmcelreath/17a0b9373b04f50e335f027c17d379f5). The main differences are that this model is multivariate and lets the presence rate vary by team. The code itself is here: github.com/JSTrostle…
It’s a lot, but not quite an eldritch horror. The data section is pretty self explanatory. The only thing of note is that the QB EPA, CPOE, and air yards are all in a matrix together rather than being vectors on their own. They’ve also all been scaled and centered too, to make the model run better. Skipping the parameter section for now, the model section has a bunch of “log” this and “log1m” that, and that’s just to help out Stan’s sampler (I read somewhere that that’s more stable; no idea if it’s true). All the “Sigma” stuff is so that the multinormal is choleskified. It definitely helped my poor, aged laptop run the model, but I don’t know enough math to even try to understand/explain what is happening behind the scenes.
The meat of the model is the “for” loop. For every observation, if that observation has a hit marked, the model notes down the QB EPA, CPOE, and the air yards, and tries to figure out the expected values for those things when there’s a hit (beta), as well as how often these hits are happening (kappa), and well as how well they’re being detected (delta, but more on that later). If the observation isn’t a hit, the model does the same thing (except with alpha instead of beta) but also looks at the distribution of expected values for QB EPA, CPOE, and air_yards and tries to figure out if any of the ones marked not a hit are misclassified. There’s a ton of behind-the-scenes algebra and math (that, again, I do not understand), but at the end the model spits out the expected value of a pass with and without a hit (for each team), the pressure rate (for each team) and a leaguewide detection rate for how often it thinks a play has a pressure but there’s no mark in the dataset. (At this point I should explain: a “hit” is if the QB is knocked down. If a QB is hit but not knocked down, that is classified as “no hit.” However, the QB should react to a hit the same way (for the most part) whether or not he’s knocked down, so this should lead to a bunch of things labeled as “no hit” having similar distributions of QB EPA, CPOE, and air yards as things marked hit. That’s basically what the model is trying to tease out)
The model isn’t perfect (hell, it may not even be good): it excludes sacks and scrambles, so a lot of pressure and hit information is missing there (the thought of having to do another mixture model for each of the variables broke my spirit on that one). It’s calculating a latent variable, so there’s no good way to check whether it’s actually working or just matching through sheer luck. The model itself is a bodge by an amateur, so it could probably be improved by at least 200 percent, speedwise. Finally, I bet you could get similar to better results by just running a regression of QB EPA, CPOE, and air yards on charted pressure data and then using that regression to predict future values. That all said, this is a model that uses 100 percent nflverse data to estimate something that’s not officially charted, so that’s pretty neat.
I don’t know how to add an HTML table into my blog directly, but I’ll learn. For now, I’ll include a photo of the table I have comparing the model estimates against Pro Football Reference’s charted pressures for the first half of the 2024 season. It doesn’t perform too poorly, in my opinion.
